Team presentation · James Lee, Nicholas Stephan & Blake Viggiano
Fluid Mechanics Aero Project
Our recorded project presentation accompanies the slides and gives another way to explore the car, design choices, and analysis.
Watch on YouTube ↗Rowan University / Fluid Mechanics final project / 2024
More downforce.
A better aerodynamic tradeoff.
A team-designed SolidWorks car built around one objective: maximize downforce relative to drag while working within the course’s physical and dimensional constraints.
Watch the project
Team presentation · James Lee, Nicholas Stephan & Blake Viggiano
Our recorded project presentation accompanies the slides and gives another way to explore the car, design choices, and analysis.
Watch on YouTube ↗01 / The objective
A useful aerodynamic design has to consider both the force pressing the car toward the ground and the drag resisting its motion. Our project focused on increasing the magnitude of downforce relative to drag.
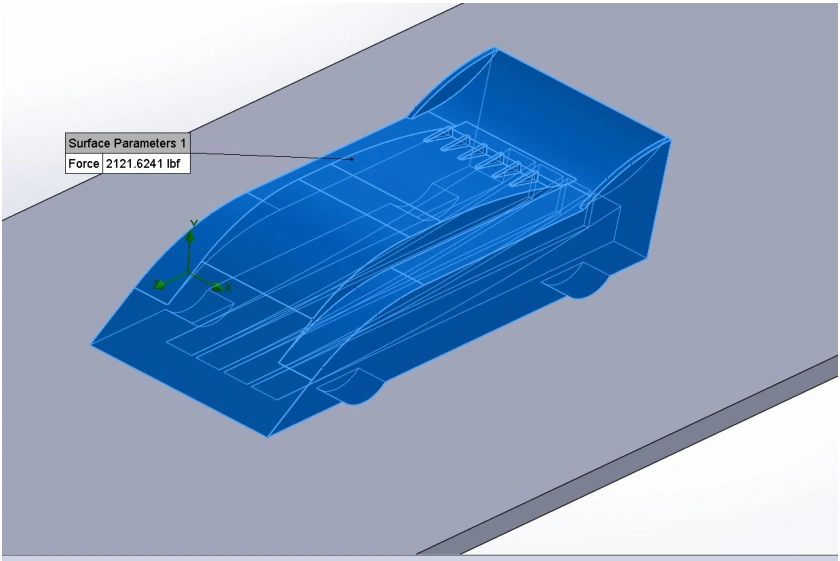
We developed the car in SolidWorks and evaluated its aerodynamic forces through flow simulation. The design combined a shaped front body, rear wing, vortex generators, and rear diffuser, rather than treating each feature as a separate add-on.
James Lee, Nicholas Stephan, and Blake Viggiano. This page credits our shared work; the slides do not assign individual responsibilities.
The original assignment sheet is no longer available. The presentation retains the dimensioned model views and our reported results, which are used here without reconstructing missing requirements or claiming a class ranking.
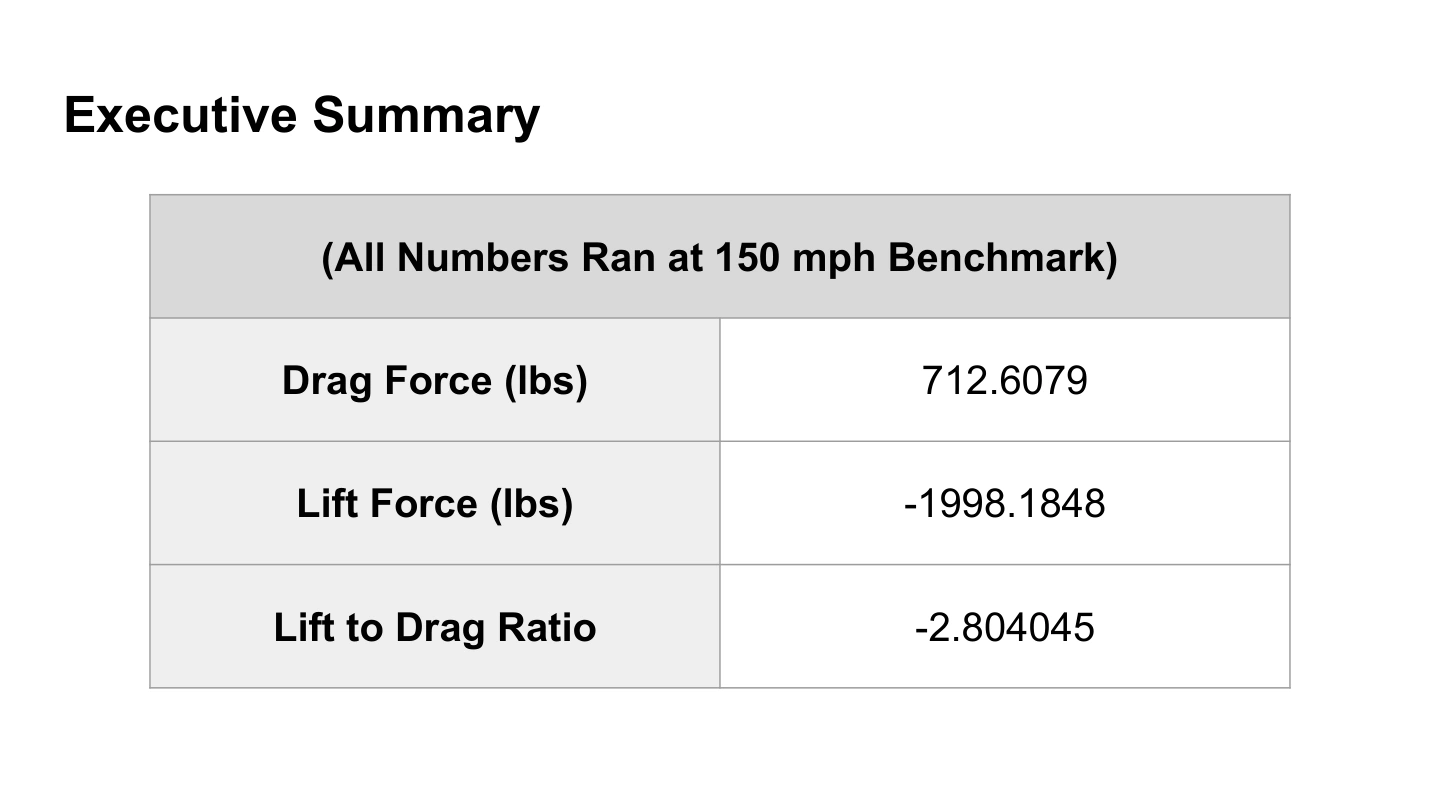
The executive summary reports lift-to-drag as −2.804045 because the lift force is negative in the model’s coordinate system. For a car, that negative lift is downforce. This page uses the positive magnitude, downforce/drag = 2.804, to make the objective easier to read.
See the original presentation · slide 2 ↗02 / Model geometry
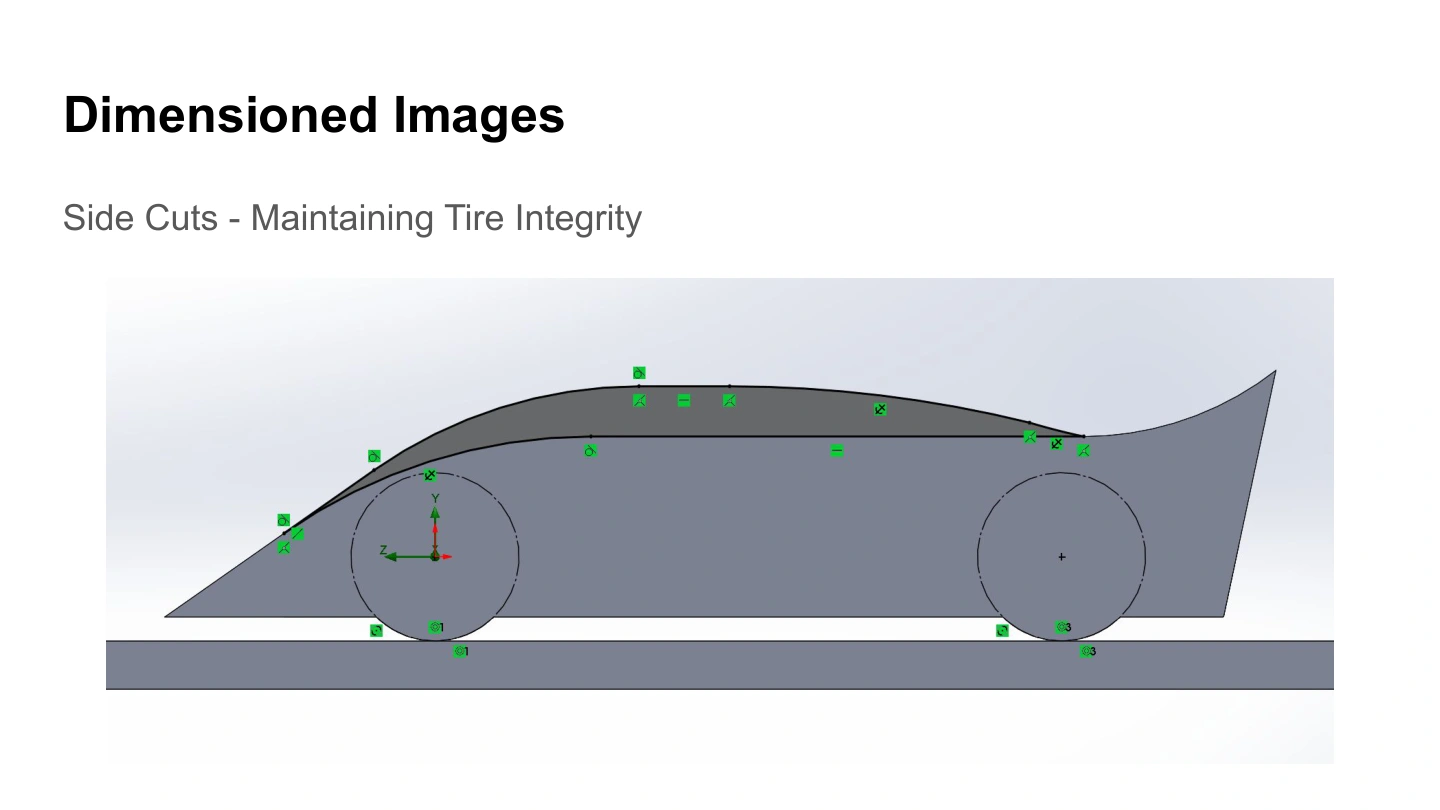
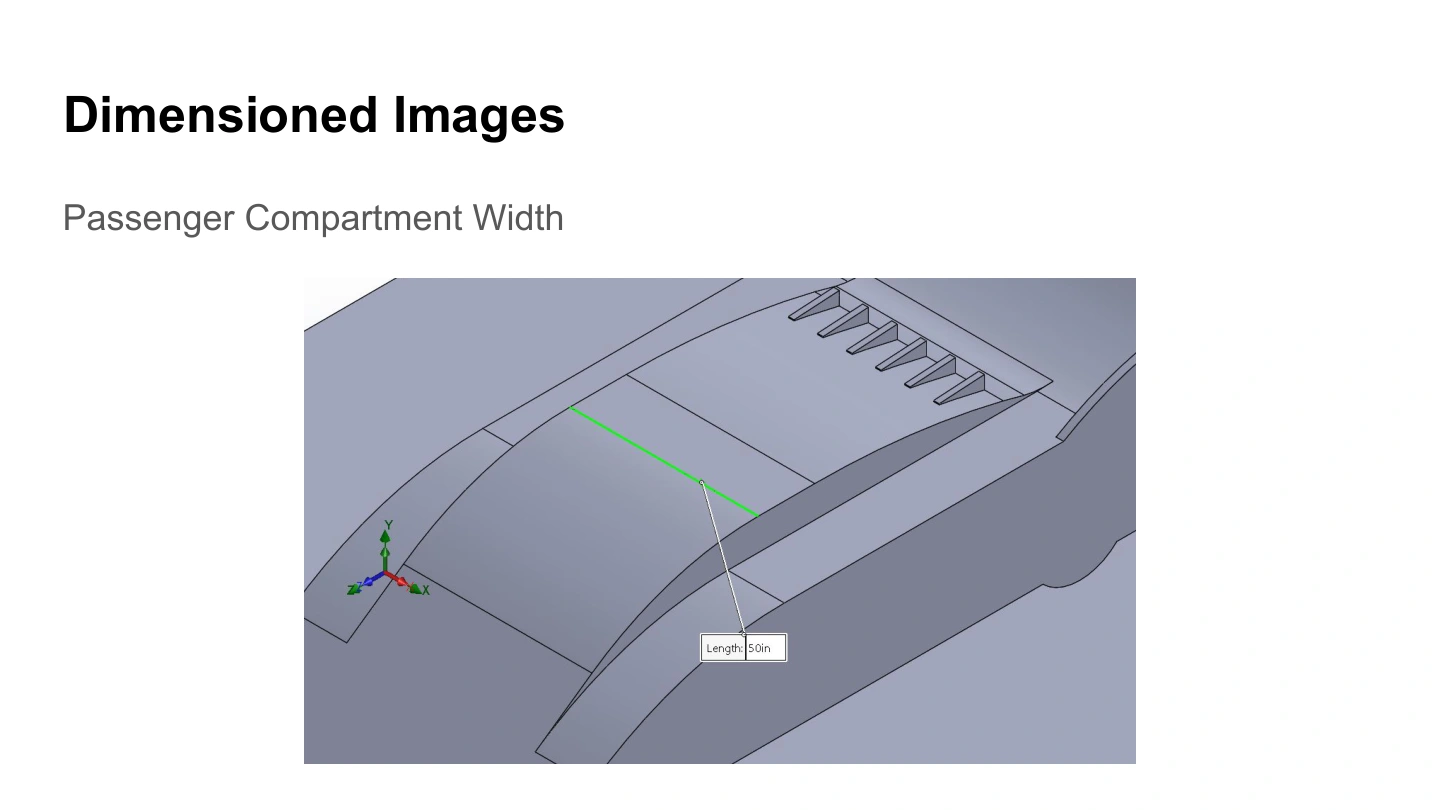
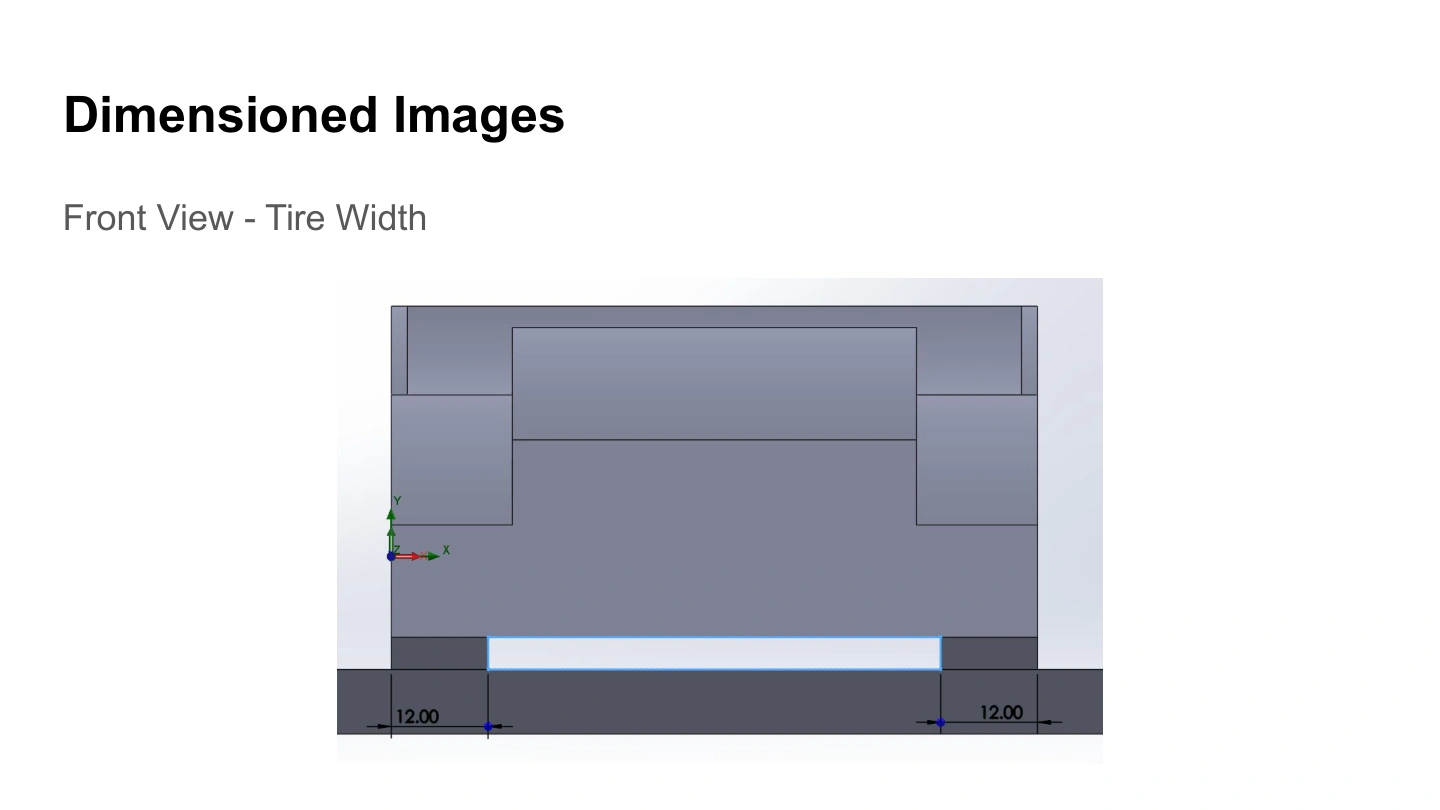
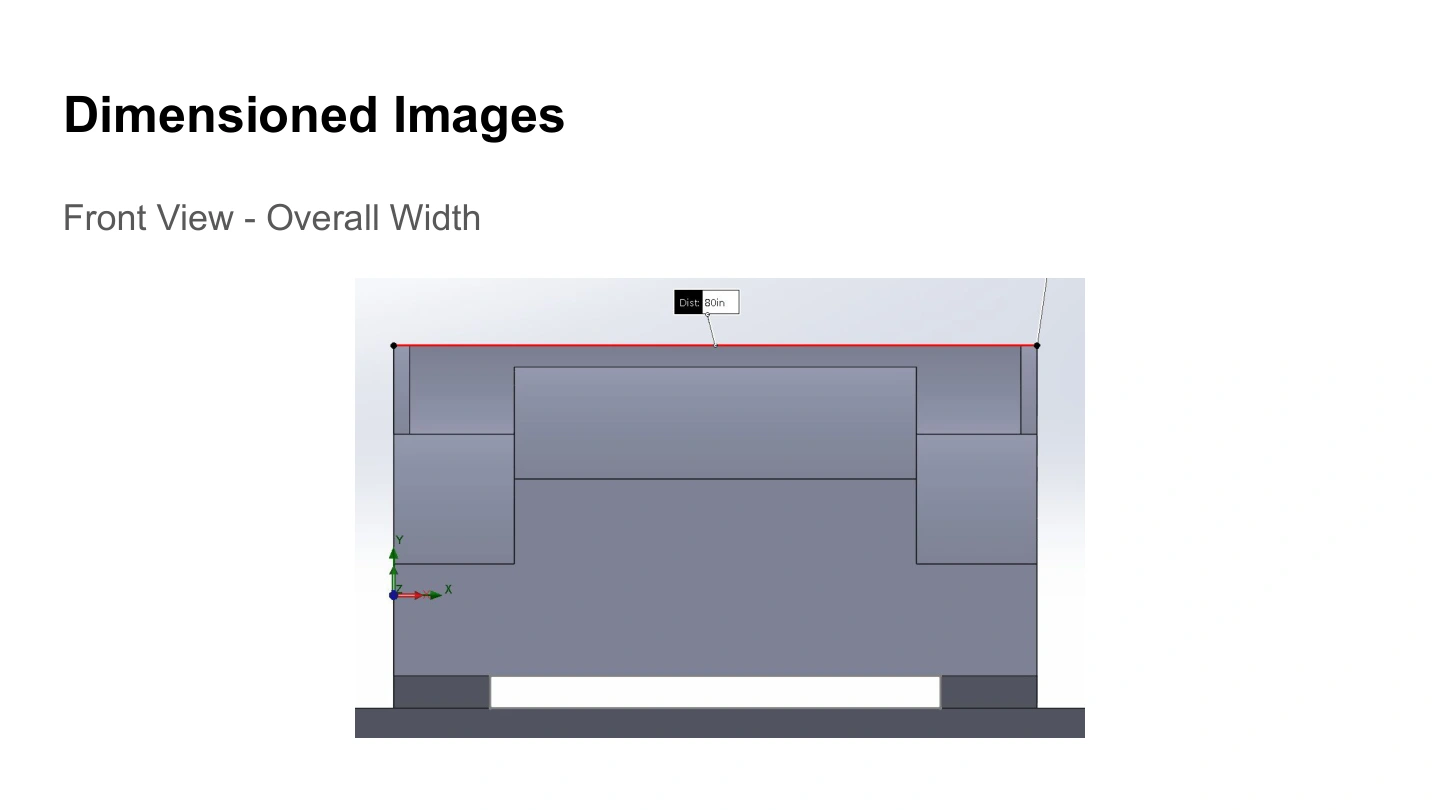
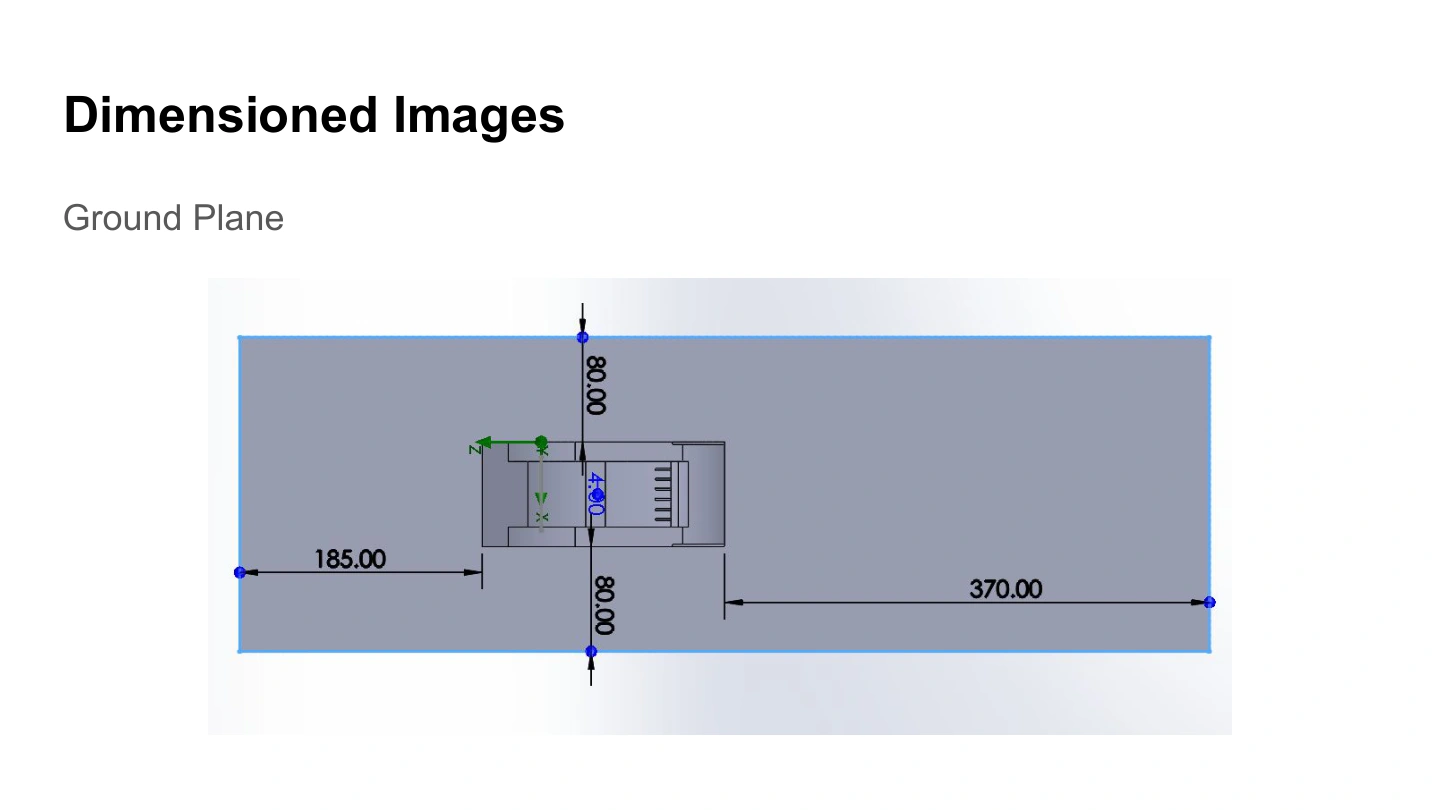
The dimensioned views document the overall side profile, tire clearance, passenger-compartment width, tire width, overall width, and ground plane.
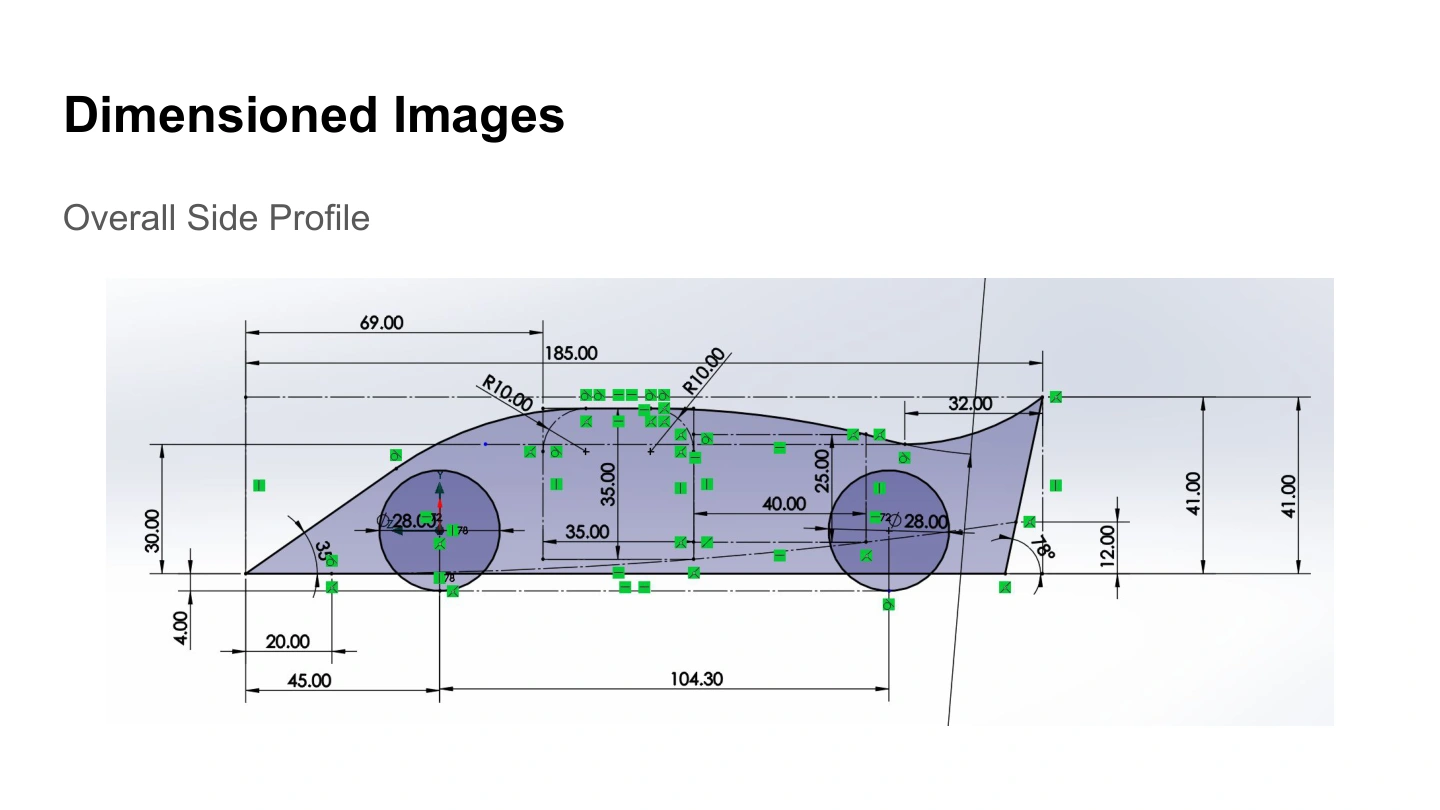
The side cuts preserve space around the tires while changing the surrounding body shape. The front views and ground-plane drawing establish the geometry used for the analysis.
These are the dimensions visible in the surviving deck. They do not provide the complete original constraint list, so exact compliance limits are not inferred from them.
See the original presentation · slide 4 ↗03 / Aerodynamic development
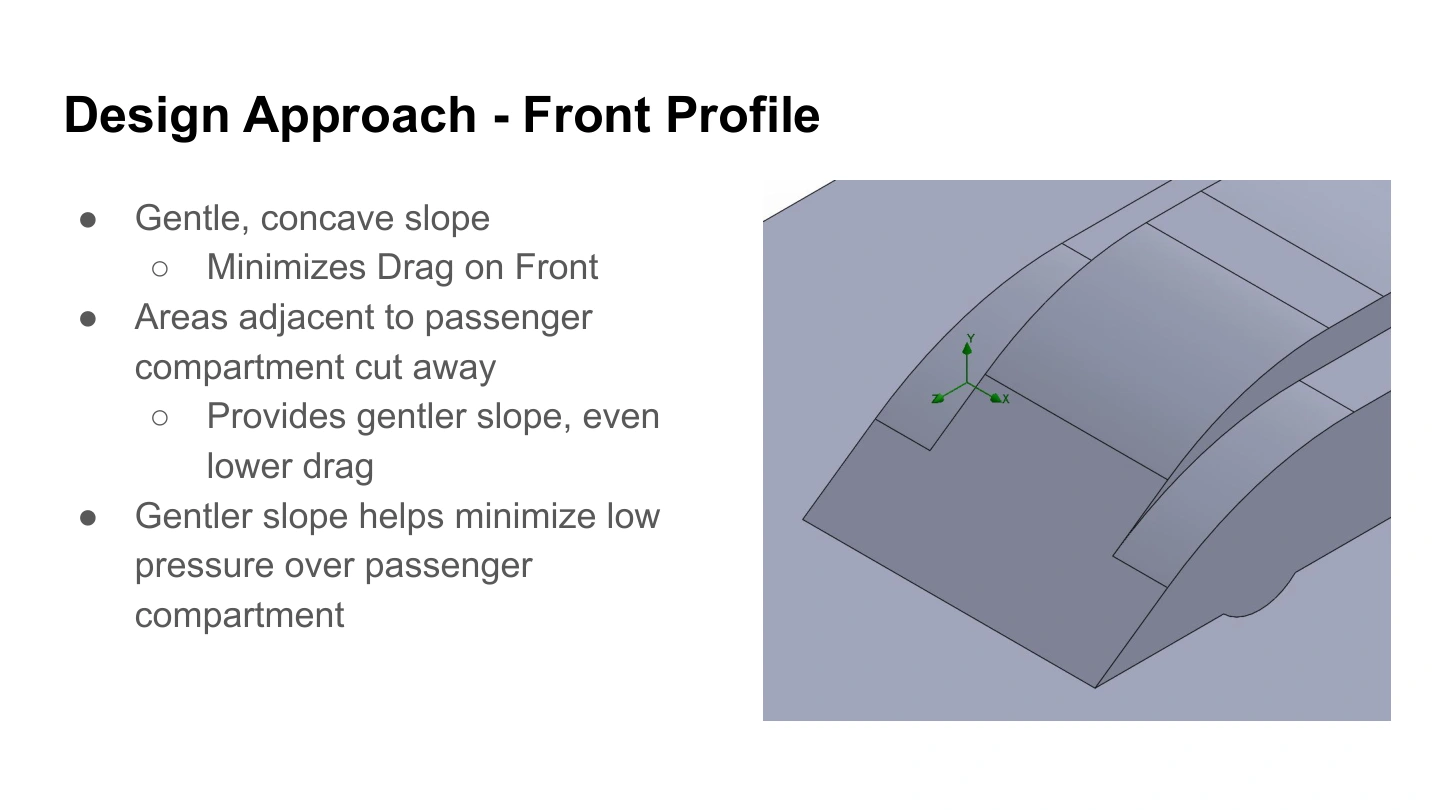
The front body uses a gentle concave slope, with areas beside the passenger compartment cut away. The team’s intent was to reduce front drag and limit unwanted low pressure above the compartment.
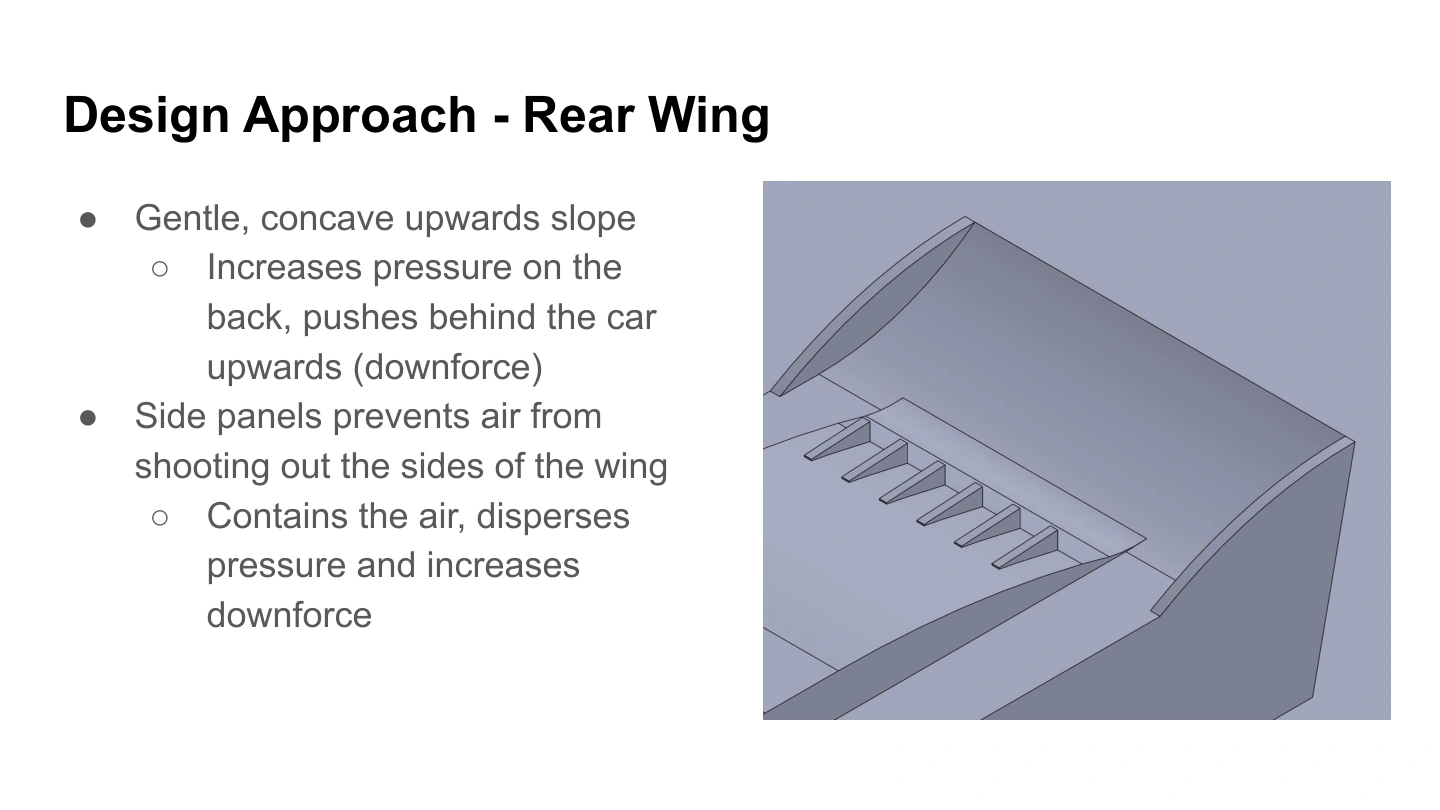
The rear wing curves upward to turn the flow and develop downforce. Its side panels were intended to limit lateral escape and help maintain the pressure loading on the wing.
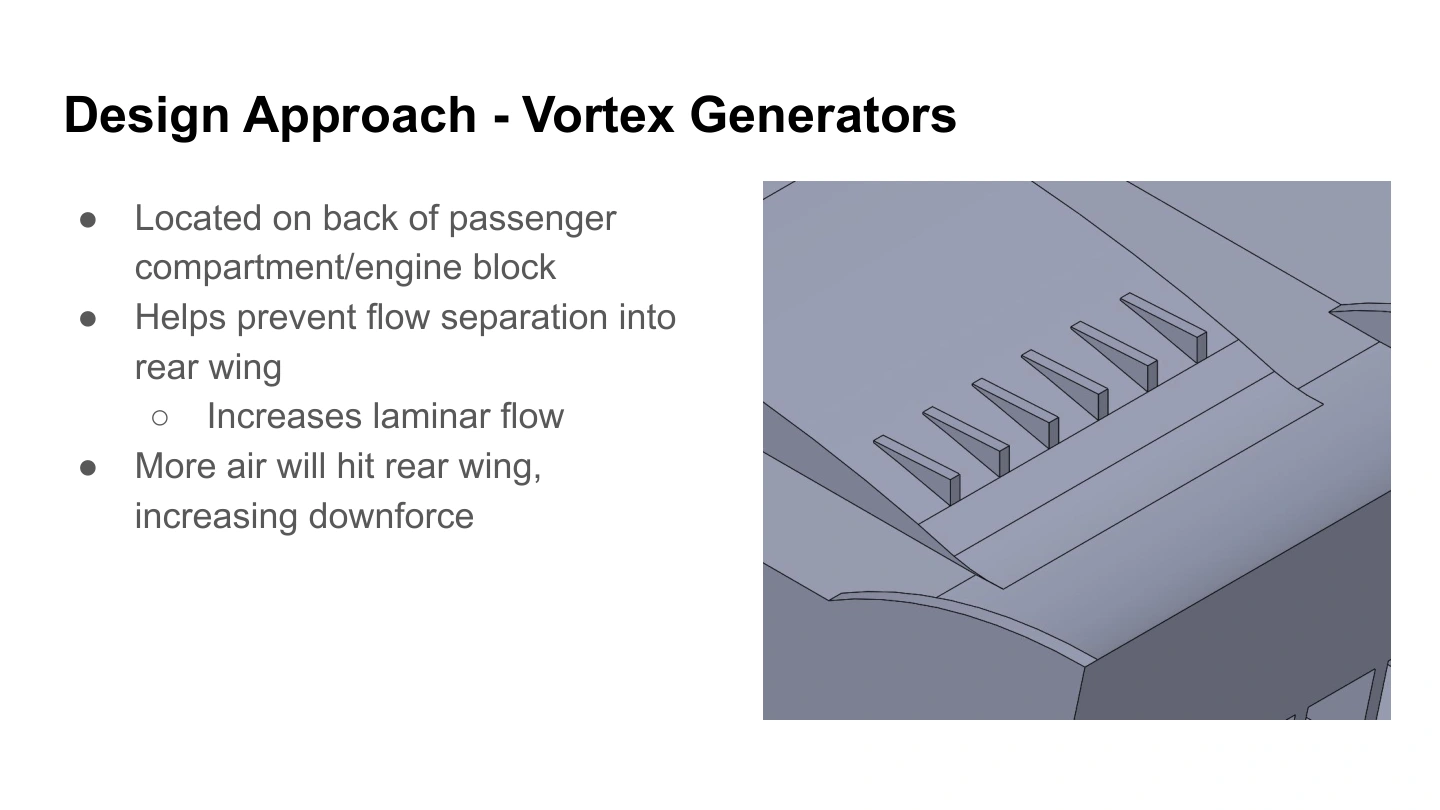
Small features behind the passenger compartment were intended to influence the boundary layer and delay separation before the rear wing. Vortex generators act through local mixing; the slides’ description of increasing “laminar flow” is treated here as a design intention to keep the flow attached, rather than a demonstrated laminar-flow result.
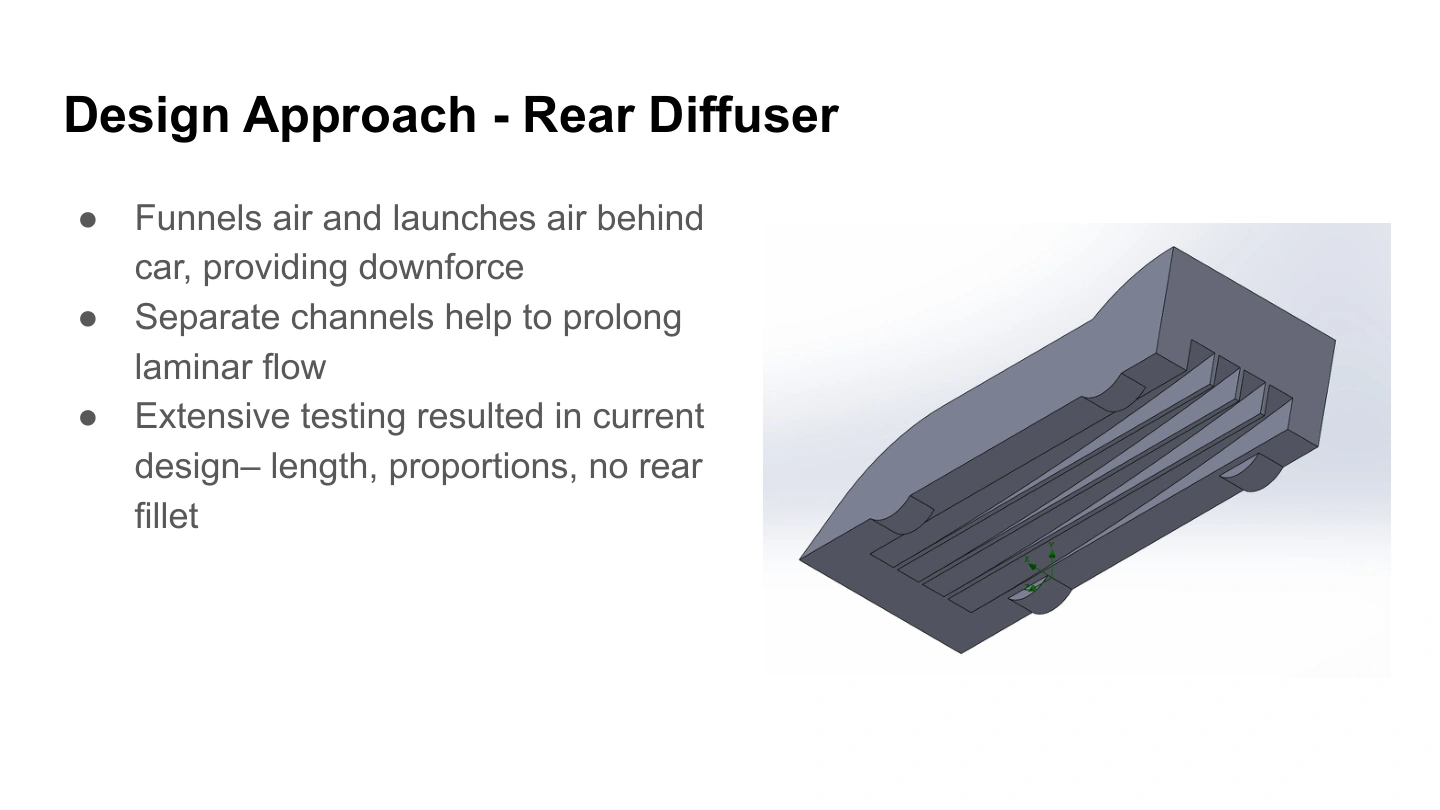
The underside uses separate channels and a rear diffuser to shape the underbody flow. The presentation records iterative testing of its length, proportions, and rear-edge treatment, with the final version omitting a rear fillet.
The final force results describe the complete model. The deck does not include a separate baseline or a force breakdown for each feature, so it does not establish how much improvement came from any one change.
04 / Simulation results
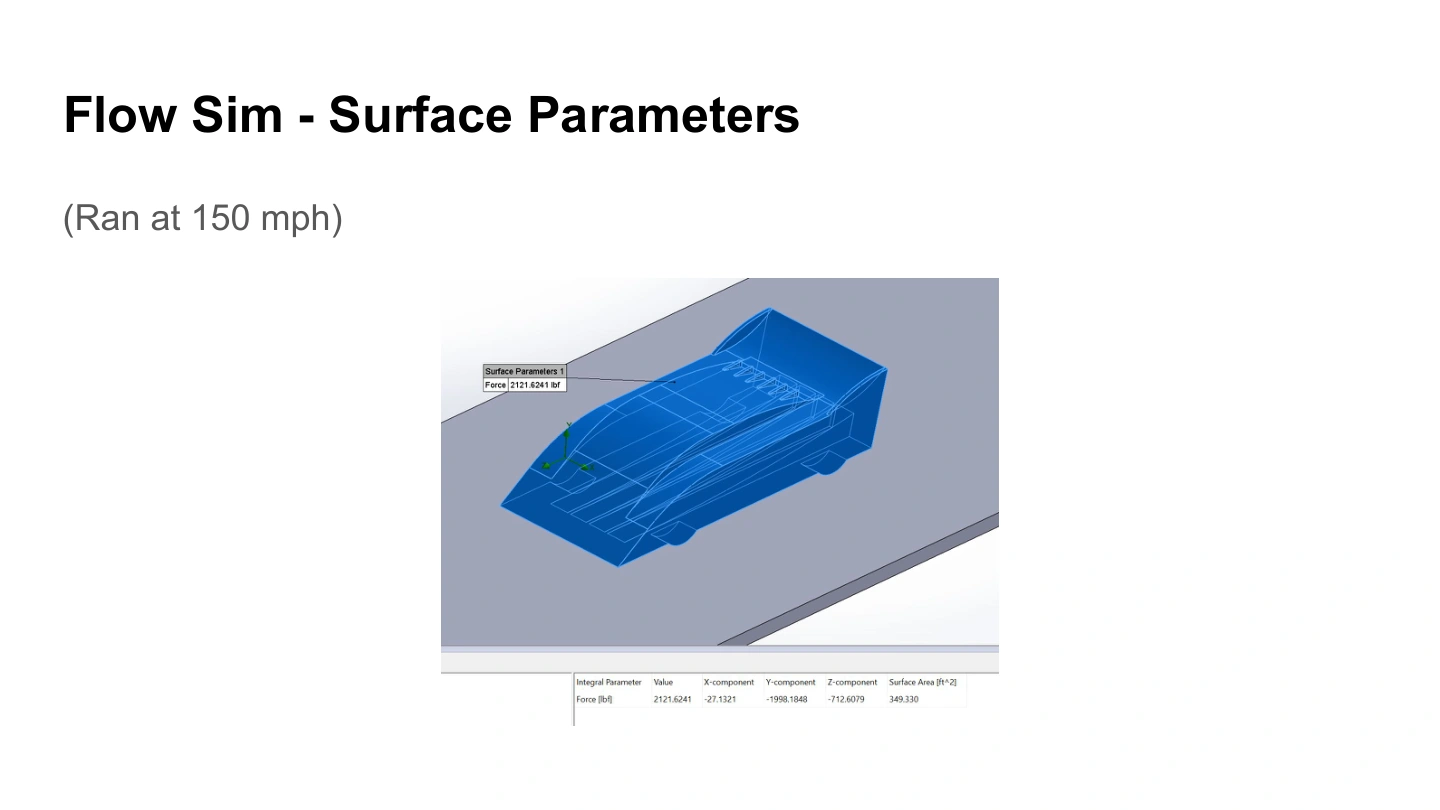
At the 150 mph benchmark, the simulation reported drag of 712.6079 lbf and signed lift of −1,998.1848 lbf. Taking the magnitude of negative lift gives approximately 2.80 units of downforce for each unit of drag.
| Speed (mph) | Downforce / drag |
|---|---|
| 50 | 2.919 |
| 100 | 3.064 |
| 150 | 2.804 |
| 200 | 2.750 |
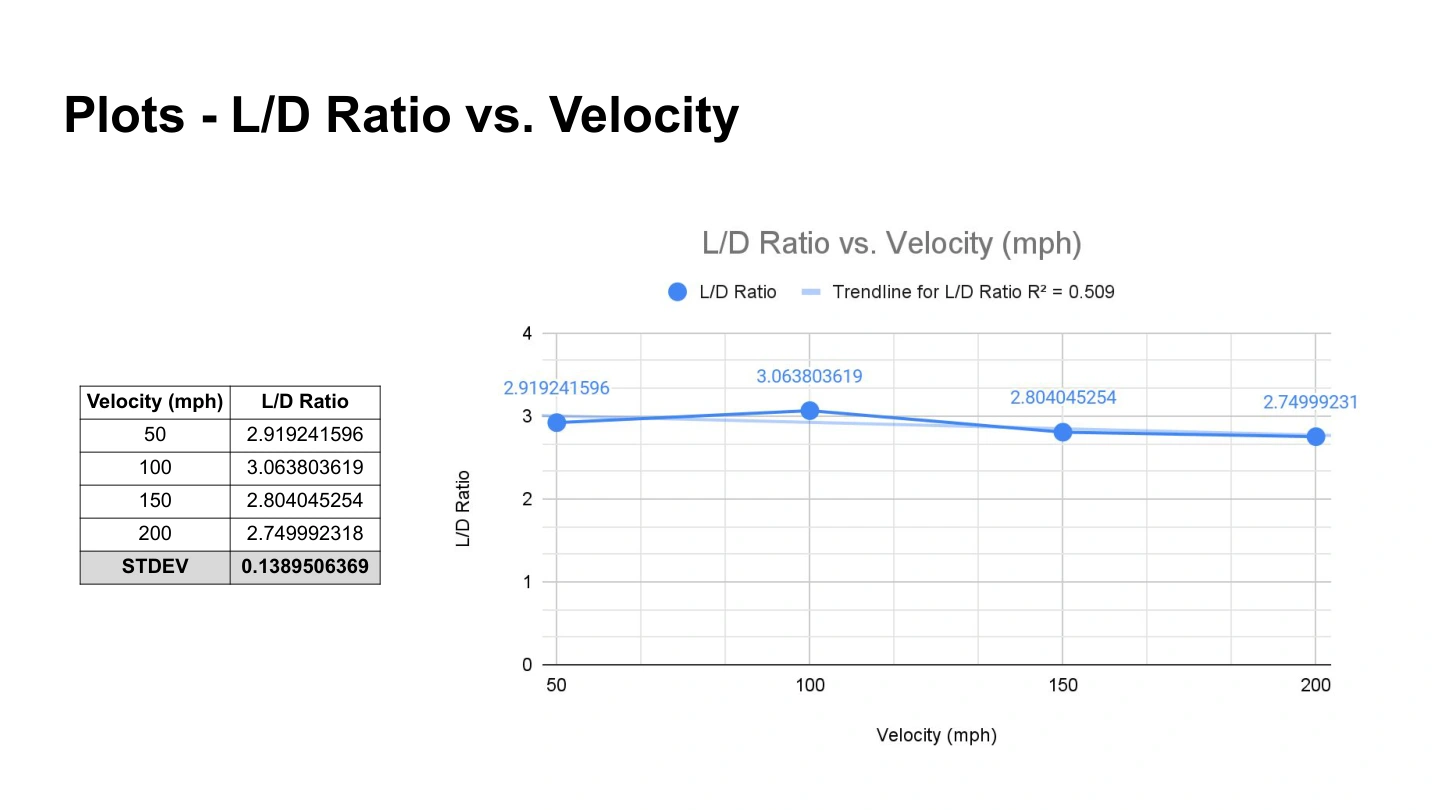
The largest ratio among these four reported runs was approximately 3.064 at 100 mph. This identifies the best of the sampled operating points; it does not establish a global optimum or a competition result.
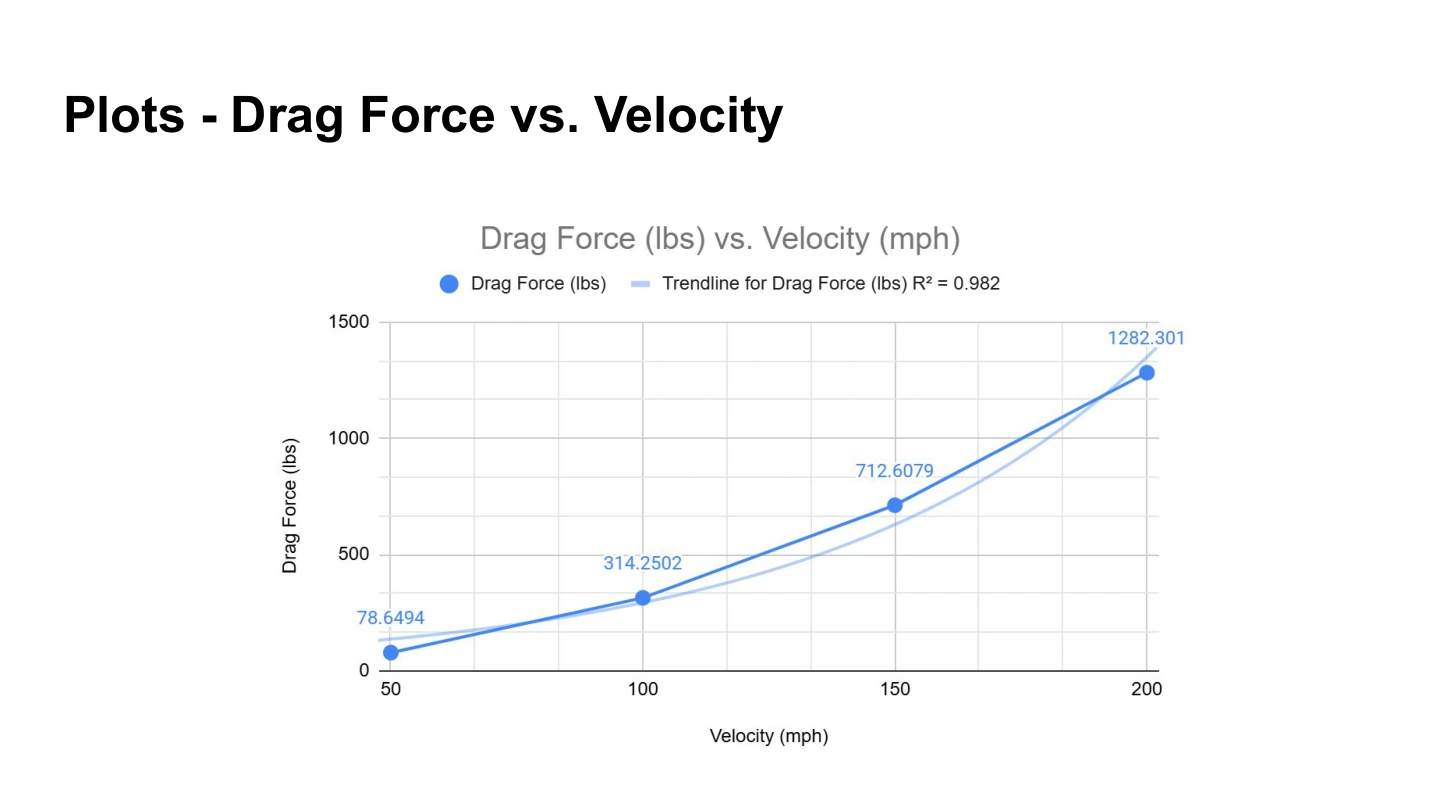
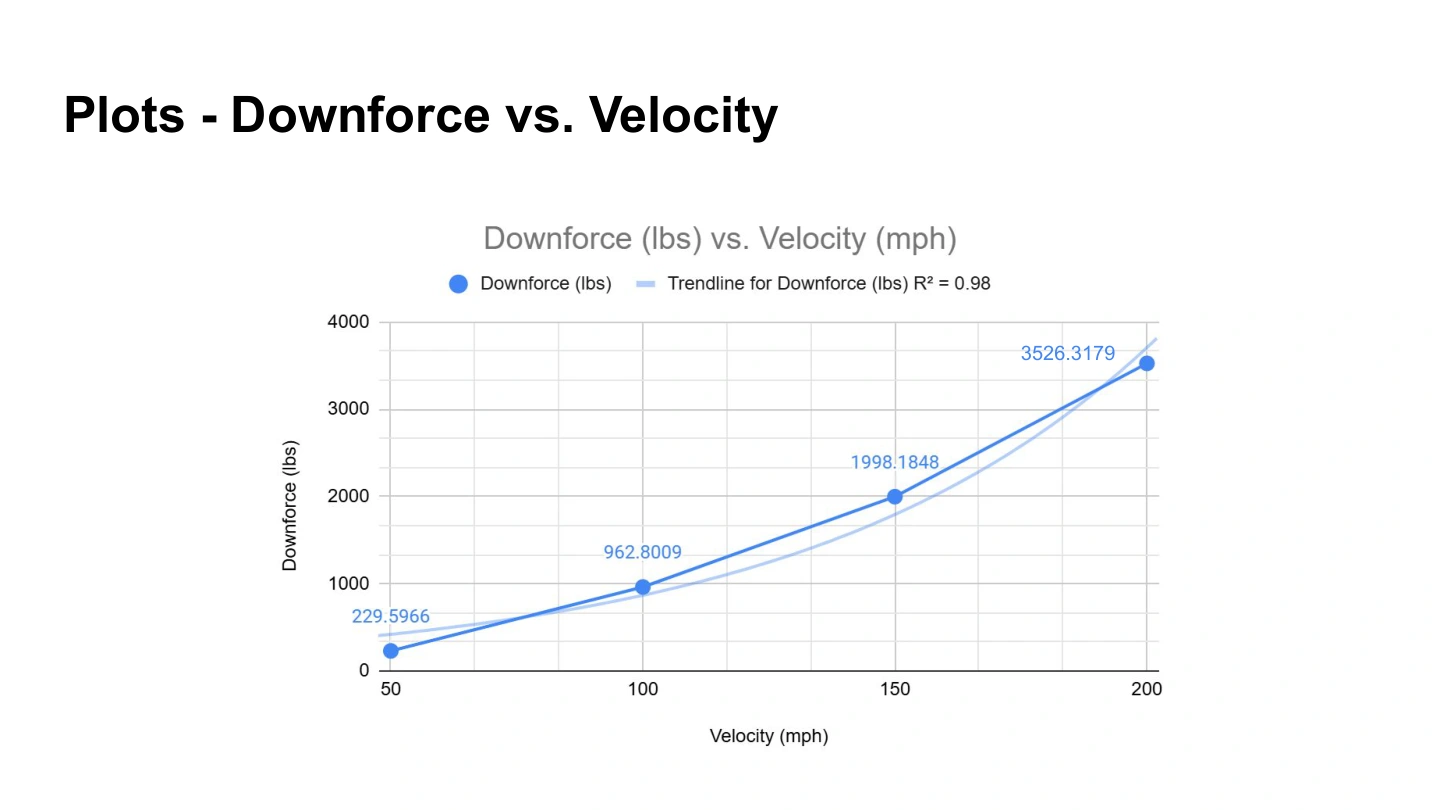
Both drag and downforce increased across the sweep. The deck reports approximately 3,526 lbf of downforce at 200 mph. More downforce therefore came with increased drag and aerodynamic power demand.
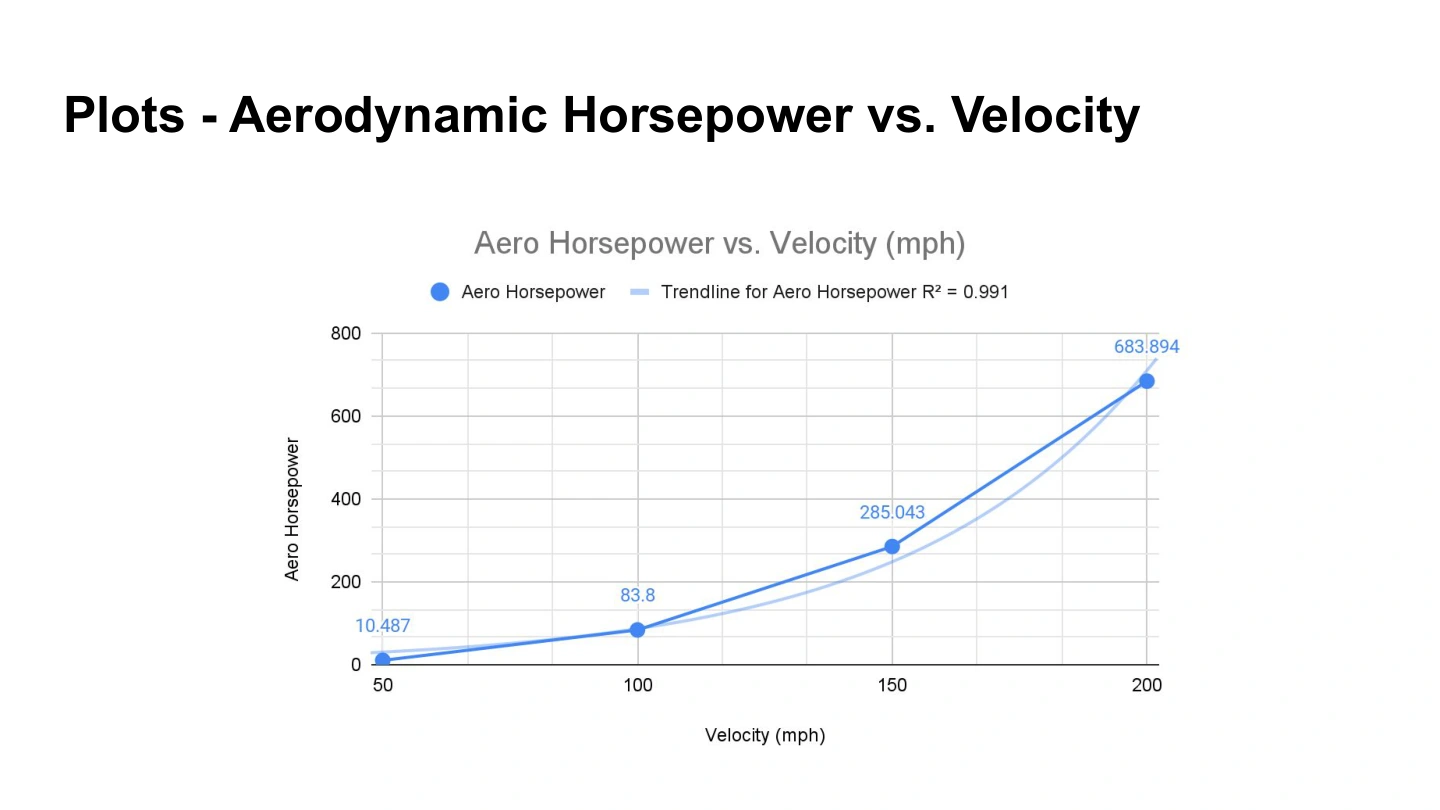
The power required to overcome aerodynamic drag follows P = D × V. At 150 mph, the reported drag corresponds to approximately 285 hp of aerodynamic power. This excludes rolling resistance, drivetrain losses, acceleration, and other vehicle loads.
These are modeled forces. The surviving presentation does not provide a mesh-independence study, convergence history, full boundary-condition settings, or measured aerodynamic validation.
See the original presentation · slide 14 ↗05 / Scaling & supporting calculations
The presentation explores a 1/20-scale model in a water tunnel by matching Reynolds number, the ratio of inertial to viscous effects. It uses a full-size reference length of 80 inches and a model length of 4 inches.
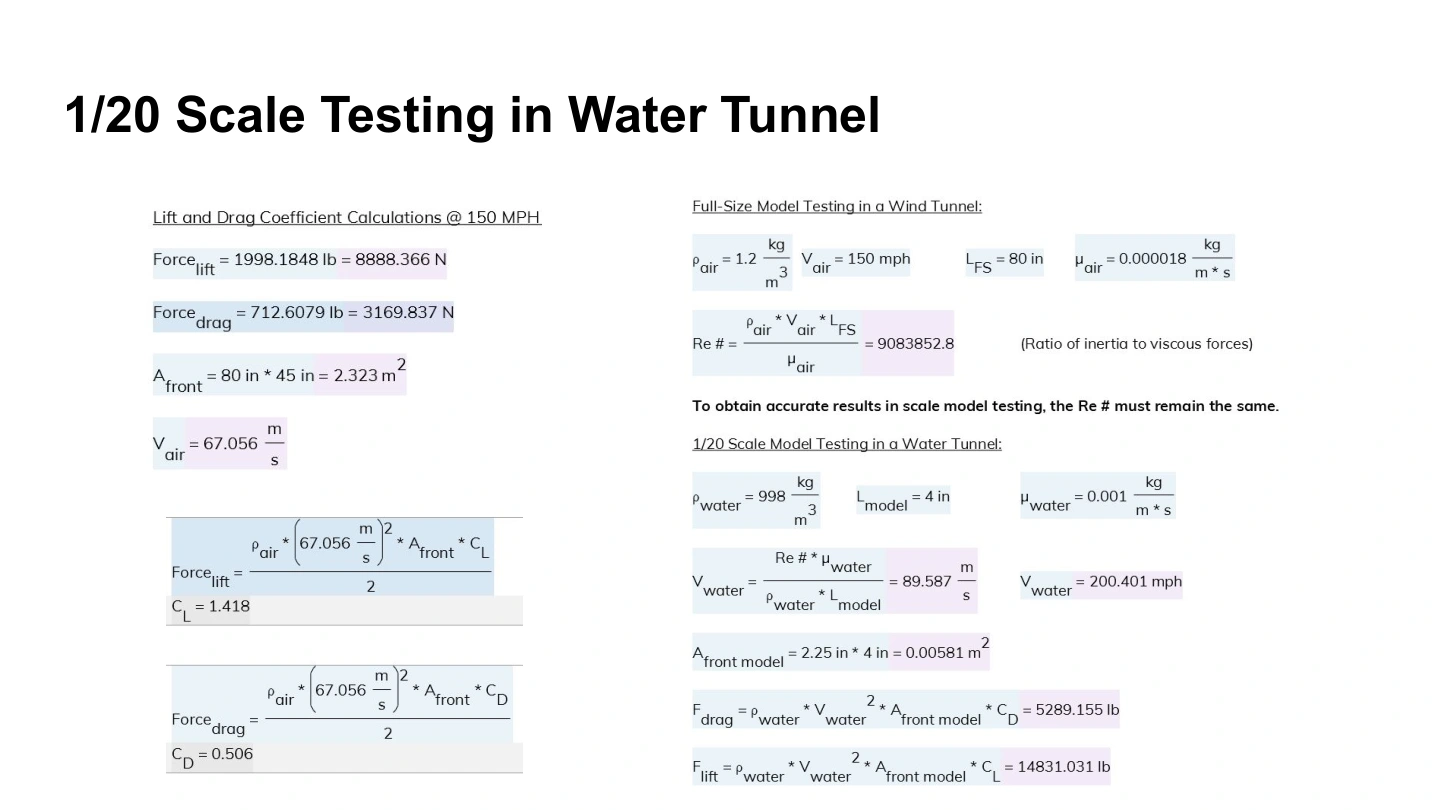
For the stated 150 mph air condition, the slide calculates Reynolds number of approximately 9.08 million. Matching it with the specified water properties requires a water speed of about 89.6 m/s, or 200.4 mph.
That demanding result illustrates a practical limitation of matching Reynolds number at this scale. The slide contains calculations, but does not document a completed water-tunnel experiment or measured forces.
The same slide calculates downforce-coefficient magnitude of 1.418 and drag coefficient of 0.506 using its stated frontal reference area. Coefficients depend on that area definition; their ratio is consistent with the reported downforce-to-drag magnitude.
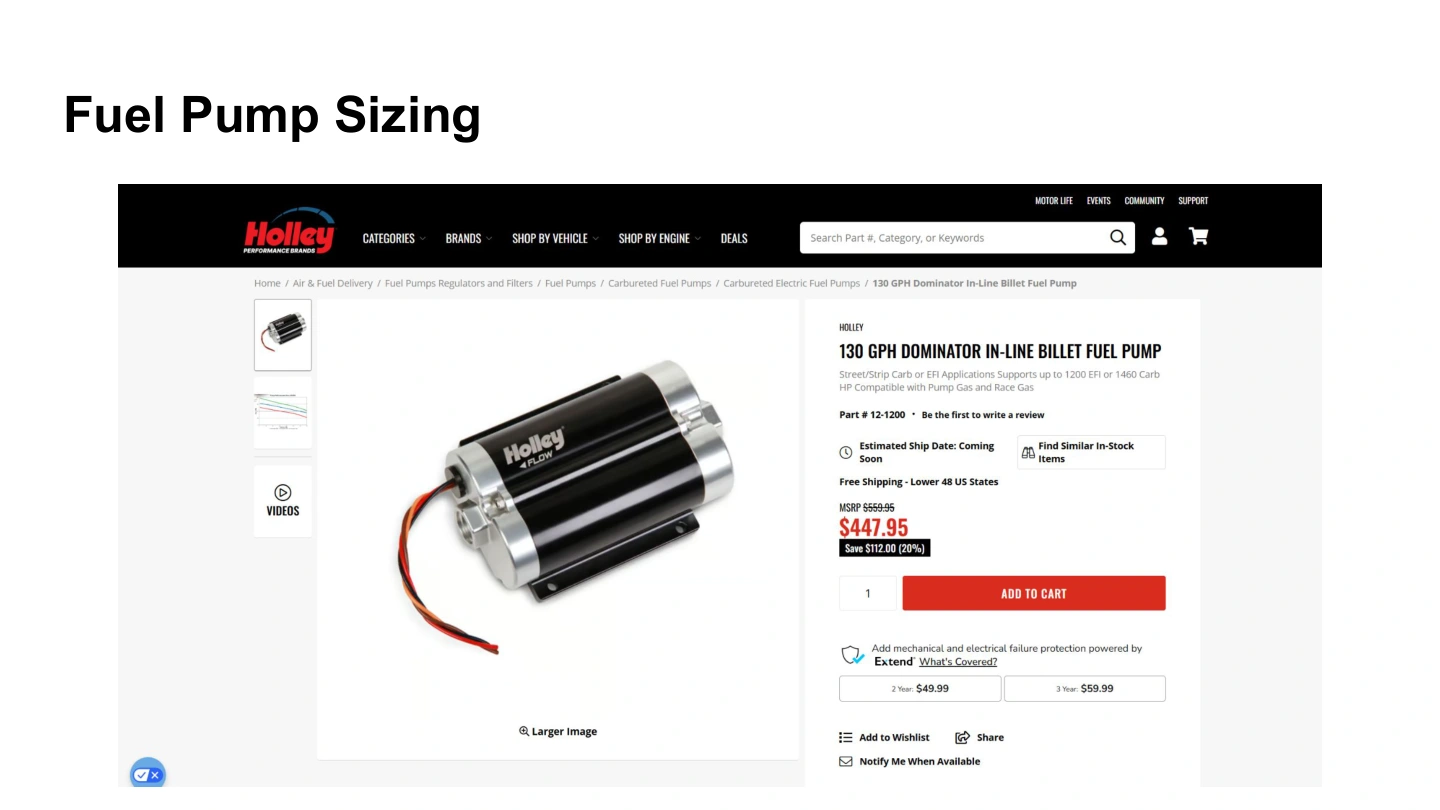
The final slide shows a Holley 130 GPH inline fuel pump as a sizing reference. It does not include the associated fuel-demand calculation, engine assumptions, or installed-system results, so a validated component selection is not claimed here.
06 / Engineering lessons
Collaborative CAD development, an integrated aerodynamic concept, and a structured comparison of modeled force and power across operating conditions. Further work would verify the simulation setup and isolate the effect of individual features.
07 / Full documentation
The complete 19-slide deck preserves the model dimensions, aerodynamic features, force summaries, plots, scale-model calculations, and fuel-pump reference.
Related engineering